

As an ecommerce seller, it is important to know when, where, and how your store’s purchases are happening. Google Analytics is a free web analytics platform that allows you to do just that. If you are new to web analytics the sheer amount of data and filters in GA can be overwhelming, especially at first. This list will give you a list of the most useful, and actionable Google Analytics reports for beginners.
Audience > Overview
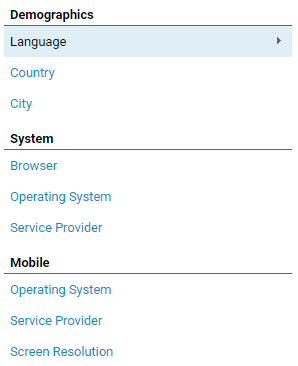
This report gives you a general overview of what type of user is looking at your online store, and how on aggregate your audience is behaving. You can see exactly how many users have been on your site, what percentage of them are new users, and how long on average they stay on your site. These metric are important for benchmarking your store’s performance, as well as identifying any potential issues with your store. In the Demographics tab you can see which locations users are accessing your site from. This tab is particularly good for fraud and bot detection. If you run a site selling surfing gear to US based customers and 20% of your traffic is coming from Ontario, Canada, this will be cause for concern.
Audience > Demographics
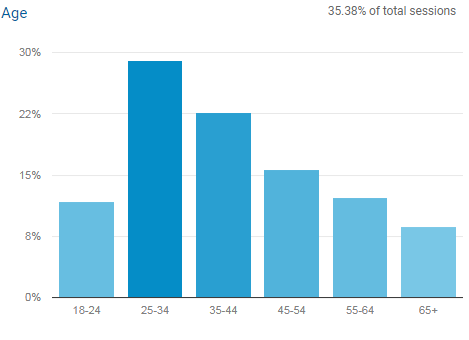
After enabling Google’s demographics reporting you will have access to information about site visitors’ age and gender. In the demographics report you can see visits, conversion rates, and revenue broken down by age group or gender. This information gives you key insights into which groups of customers are the highest value. If you are running targeted marketing programs, this report also gives you an idea of where your advertising dollars are best spent. One limitation with this report is it often uses sampled data, in the example above you can see that this report only takes into account 35.38% of user sessions.
Acquisition > All Traffic > Channels

Google Analytics automatically groups traffic into “Channels” according to how the user came to your site. Tracking visits, revenue, and other metrics by traffic source is incredibly useful for determining how exactly customers are coming to and interacting with your site. With this report, you can monitor the success of your promotional efforts. For example, if you recently decided to spend more time promoting your products on Facebook and Instagram, you would expect your visits from the Social the channel to increase. By clicking on an individual channel you can see exactly which websites are contributing to channel.
Behavior > Speed Suggestions
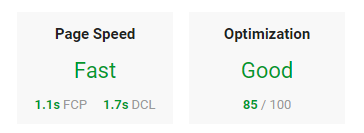
This reports is a little different than the other reports on this list—rather than giving you information about visitors, it gives you information about how your site performs from a technical standpoint. In the Speed Suggestions report you will find how long each of your pages takes to load, along with recommendations for speeding up your pages. By clicking on “PageSpeed Suggestions” you will see a breakdown of how optimized a page is for speed, along with detailed suggestions to make your page run faster. A slow page can greatly decrease your conversion rate, so it’s important to identify speed issues as soon as possible.
Discover

Though this isn’t quite a report, but it’s more than worth mentioning. The discover tab offers several resources to enhance your Google Analytics experience. You can check out the Google Analytics Demo Account to see what a fully implemented GA profile like. In the custom alerts sectio,n you have the ability to set up email notifications when data suddenly changes—this is a great tool for identifying issues with your site early. With Analytics Academy you can access beginner and expert level courses to expand your GA knowledge. The amount of great resources in this tab makes you wonder why it is hidden at the bottom of the UI menu.